I wrote last week about liquefaction generally and tried to set the scene. Fundamental to safe carriage in the IMSBC Code is the concept of Transportable Moisture Limit (TML). It has been suggested that a single figure for a cargo does not properly reflect all possible behaviours, but in my experience the safety margin built into the Code is sufficient that if you apply the TML concept properly, the cargoes will carry without significant incident. Indeed, the idea of a TML has gained such traction recently in the maritime industry that I sometimes see figures for “TML” on declarations for agricultural cargoes which aren’t Group A at all – it is being erroneously used to indicate the maximum safe moisture level for avoiding cargo deterioration on board.
Returning to Group A cargoes, Section 8 of the Code tells you that there are test methods for determining TML, and the standard/recommended ones are to be found in Appendix 3 to the Code.
Unfortunately, Appendix 3 is where testing starts to get complicated. There are now no fewer than six different methods listed in the appendix. Three of these are variations on the Proctor Fagerberg test modified to be suitable for specific commodities and are relatively new additions to the Code.
Until recently, there were three methods listed in the Code, and those three will be the subject of this article. It has always been within the power of the various member Competent Authorities to approve alternative test methods, but as far as I am aware this has never been commonly encountered if at all. Furthermore, until relatively recently, the only method widely available internationally at commercial labs was the Flow Table Test.
The concept of TML was developed from another parameter, the Flow Moisture Point (FMP), and the original research into safe moisture levels and cargo testing was carried out on metal sulphide concentrates. Concentrates such as lead, zinc and copper have been shipped for many years and all tend to be Group A cargoes.
Flow Table
The flow table test measures FMP, which is defined as the moisture content at which a commodity starts to exhibit flow properties. The test involves inputting energy in a defined manner into the sample and monitoring the behaviour of the sample under those conditions.
Flow is defined for the flow table test when the cone of sample on the table spreads by a certain amount or slumps. If the sample doesn’t exhibit flow, water is added and the test repeated until it does. By this procedure, the flow moisture point is established by actually determining the moisture content of samples which have shown flow properties during the test along with those which do not.
One potential difficulty with the flow table test is that the methodology requires the operator to determine when a sample is in a flow state by observations during the test itself. The Code does not define exactly how, although there are descriptions of what to do.
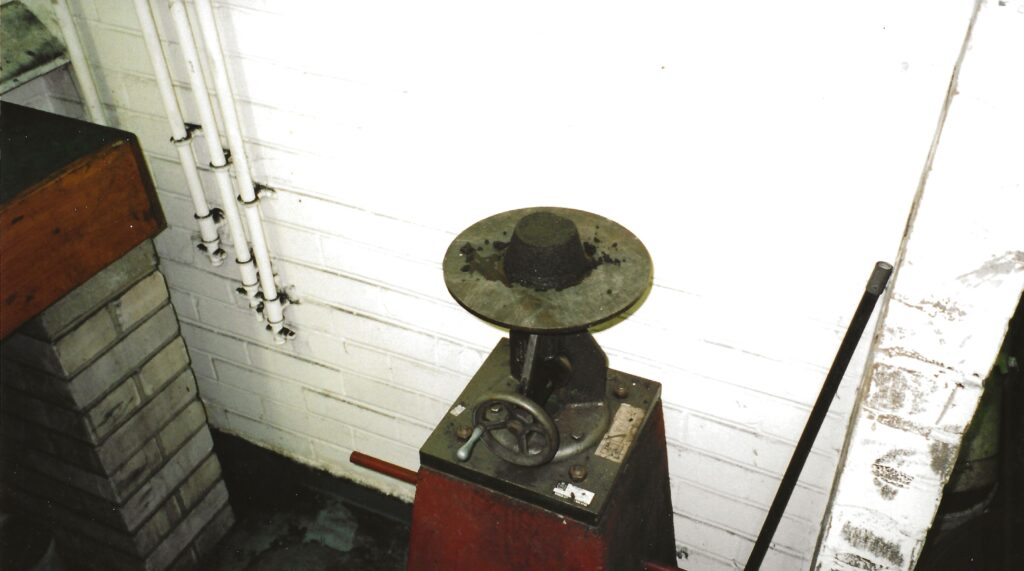
Each test run involves a sample being loaded into the mould in a prescribed way. A spring-loaded device known as a tamper is used to squash the sample into the mould and provide a degree of compression/consolidation to start with. One problem with the flow table test which has largely now been solved is that the necessary calibrated spring-loaded tamper wasn’t available commercially.
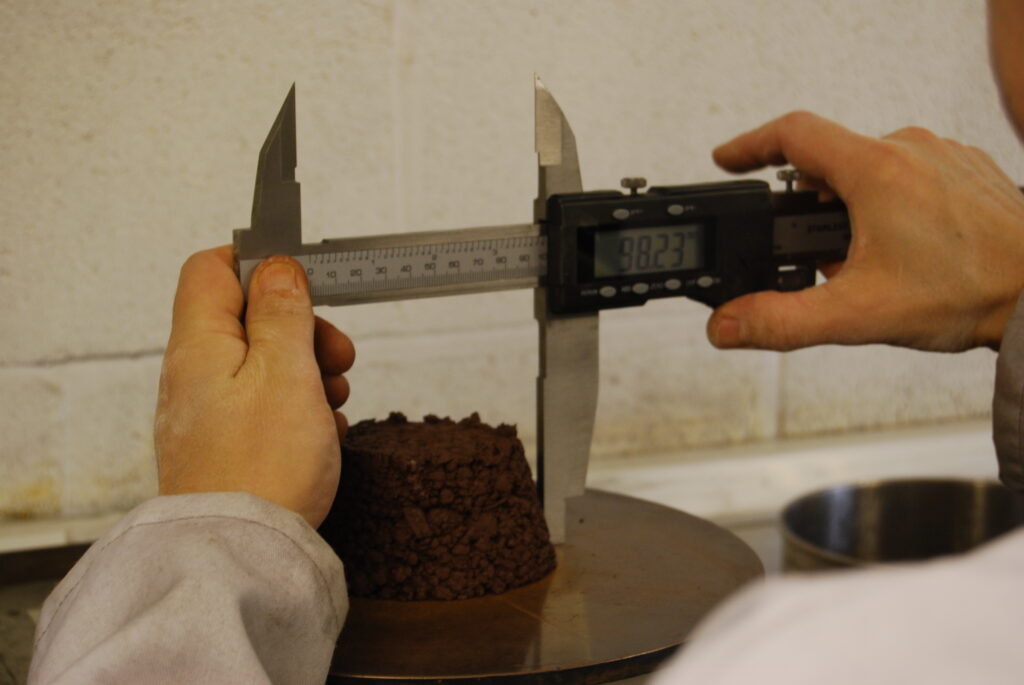
Following removal of the metal mould shape, the resulting cone is measured prior to operating the table.
The table is then operated (up to) 50 times. Each turn of the handle lifts the table and allows it to drop 12.5mm. The method calls for the 50 drops to take two minutes.
After the table has been operated 50 times, the resulting material on the table is examined and measured. The IMSBC Code says measurements of the diameter are a useful diagnostic, and refers to a cone expansion of 3mm as being significant. Different laboratories have used this information in different ways. I can’t go into too much detail in this article but if full documentation of the test conditions is available from the laboratory, an expert can see how the stated result was obtained and what criteria were used.
The flow table is relatively inexpensive to buy, but it is important to ensure that a table meets the required design specification.
There are limitations associated with the flow table test. One is a consequence of the physical size of the mould into which the sample is placed on the table and relates to the maximum particle size.
The flow table is generally suitable for mineral concentrates or other fine material with a maximum grain size of 1 mm. It may also be applicable to materials with a maximum grain size up to 7 mm. It will not be suitable for materials coarser than this …
IMSBC Code Appendix 3
Widespread use of the flow table test for nickel ores having a proportion of much larger particles present has now been in place for a number of years, but the “fix” used has never been approved by IMO.
This fix works by considering nickel ore to be an assembly of larger particles embedded in a continuum made up of the more fine material. The flow table test criteria of 7mm is a workable limit for many nickel ore cargoes – removing the material above this size results in a testable working sample. The assumption made is that the liquefaction of the material as a whole (with the oversize) is solely governed by the behaviour of the sub-7mm fraction. The oversize is present in the cargo but is “along for the ride” without participating in the liquefaction. There is a further assumption which is that the moisture associated with the larger particles remains with them when sieved out, leaving the moisture associated with the finer material. Thus if flow table testing is carried out on the 7mm fraction alone, that provides a TML relevant to sieved samples. Provided the average moisture content is also tested on a sieved sample, the effect will be to ensure that the moisture level in the sub-7mm part of the cargo as a whole is below its TML, and hence the cargo can be assumed to be safe.
The obvious problem with this approach is that the moisture content of a sieved sample will tend to be different to the cargo as a whole. Most cargoes are bought and sold on terms which include specifying the cargo moisture levels. That isn’t for safety reasons but rather to act as a control for how much water is being bought rather than (here) nickel-bearing ore. Thus the moisture content entered onto the cargo declaration is not the same as the one used in the cargo sales contract. It is sometimes difficult to establish whether this has been done correctly.
Penetration Test
The penetration test was developed in Japan as an alternative to the flow table test, but it has certain similarities. This test is also repeated with additions of water until the sample exhibits flow properties. For this test, the energy input into the sample is in the form of a vertically oscillating platform onto which the sample is placed in a vessel. These vessels are much larger than the conical moulds used for the flow table test, and hence the penetration test can accept much larger particles.
The penetration test is generally suitable for mineral concentrates, similar materials and coals up to a top size of 25 mm.
IMSBC Code Appendix 3
The ability to accept samples containing much larger particles is one advantage of the penetration test. Another is that the definition of a flow state is given in terms of the distance penetrated by brass weights into and below the sample surface during the six minutes the vibrating table is run for on each test run. No subjective observation is required. The rate and amplitude of oscillation of the table are specified in the Code. In the video below a sample of iron ore fines can be seen to enter a flow state – signified by the brass weight penetrating the sample surface. Note that the video has been shortened from the original six minutes.
The flow table test and the penetration test have one fundamental thing in common. During the testing itself, each test run involves taking a working sample and subjecting it to the input of energy. This is meant to simulate the vibrations and motion on a ship, which is when liquefaction might take place. Water is added and the test runs repeated until a flow state is achieved, and thus the flow table and penetration test both create a flow state which the operator will see. In the flow table test, the sample will slump and expand during the test. On the penetration test rig, the metal bit will sink into the cargo sample, and other changes in the sample will be seen – perhaps water will come to the surface or the surface will become smooth.
Equally, if the sample is received in a state in which a flow state occurs on the first test, the operative will know immediately that the cargo as sampled will not be considered suitable for carriage.
The Code defines TML as 90% of the FMP for most materials. That 10% is a safety factor.
Proctor/Fagerberg Test
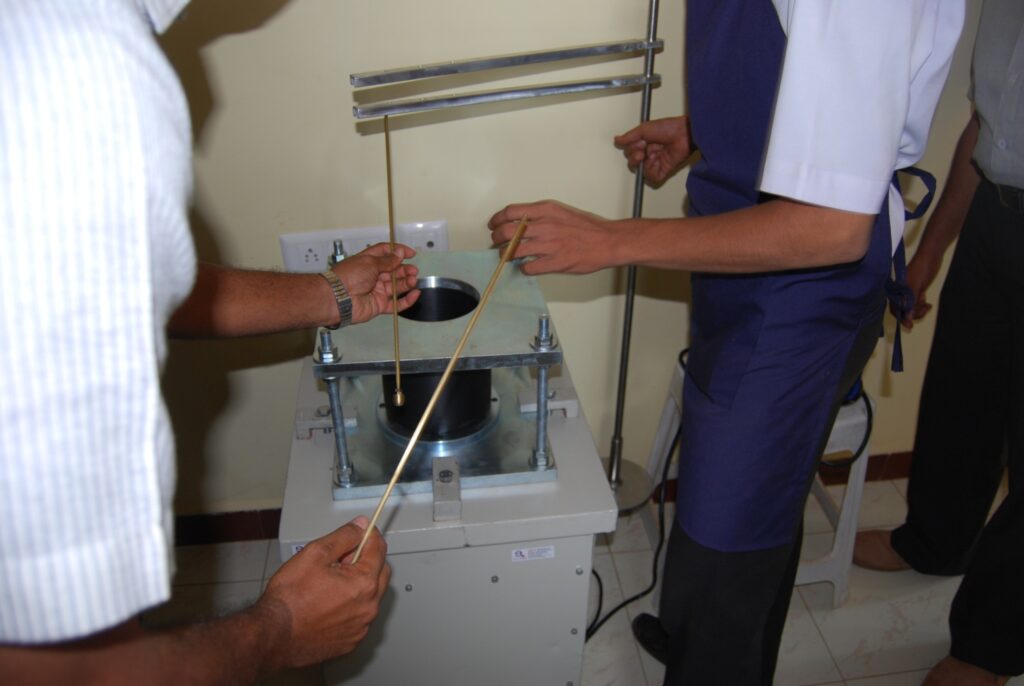
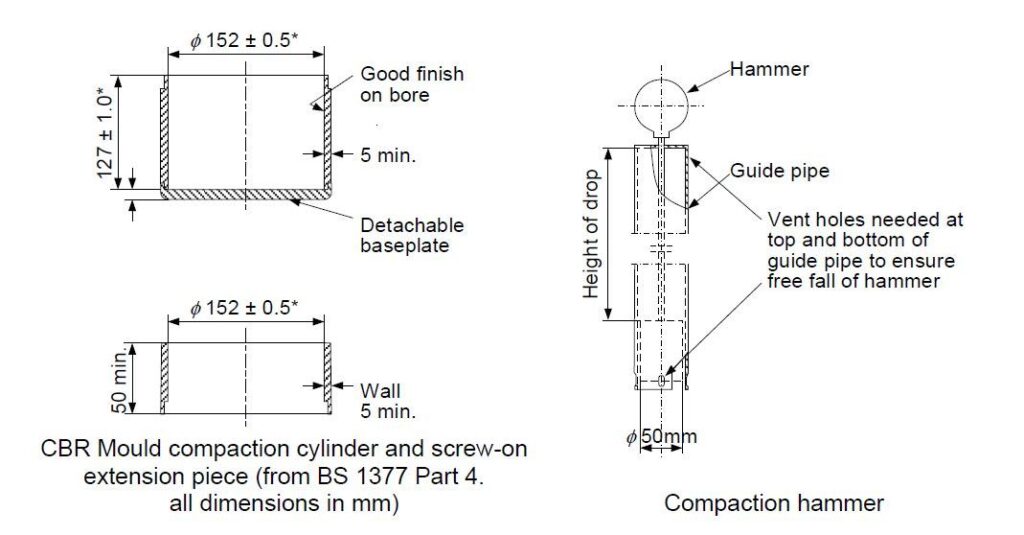
The third of the three long-standing tests is the Proctor/Fagerberg test. Until relatively recently this was not in widespread use in shipping, but it has always had its fans. This test works on a different principle to the flow table and penetration test. Here, the test runs involve packing the material of the cargo sample into a mould using a hammer. The weight of that hammer is specified by the method as 350g. The different test runs are not designed to result in liquefaction, and indeed no visual observations are required.
Liquefaction happens when the balance between solid particles, interstitial air and interstitial water is such that rearrangement of the assembly of particles when exposed to energy/vibration results in the interstitial water mediating particle to particle contact. The pressure of that water then supports the material above rather than particle to particle contact. This process was introduced with an illustrating diagram in my last article on liquefaction.
Proctor/Fagerberg replicates that compaction and rearrangement process using the hammer blows. As the density changes with increasing water, the test observations can be used to produce a curve from which the transportable moisture limit (TML) can be obtained.
The Proctor test does not produce an FMP and no observations of the cargo in a flow state will be possible during a test. The calculations required to process the raw data obtained during a test run, in order to plot a meaningful graph and establish a figure for the TML, are somewhat complex, and are a possible source of errors during testing. TML in this test is defined in terms of the moisture required to produce 70% saturation in the sample under compaction. Without the visual observations from the test itself there is no “sanity check” on the result obtained. That is one disadvantage of the Proctor/Fagerberg test.
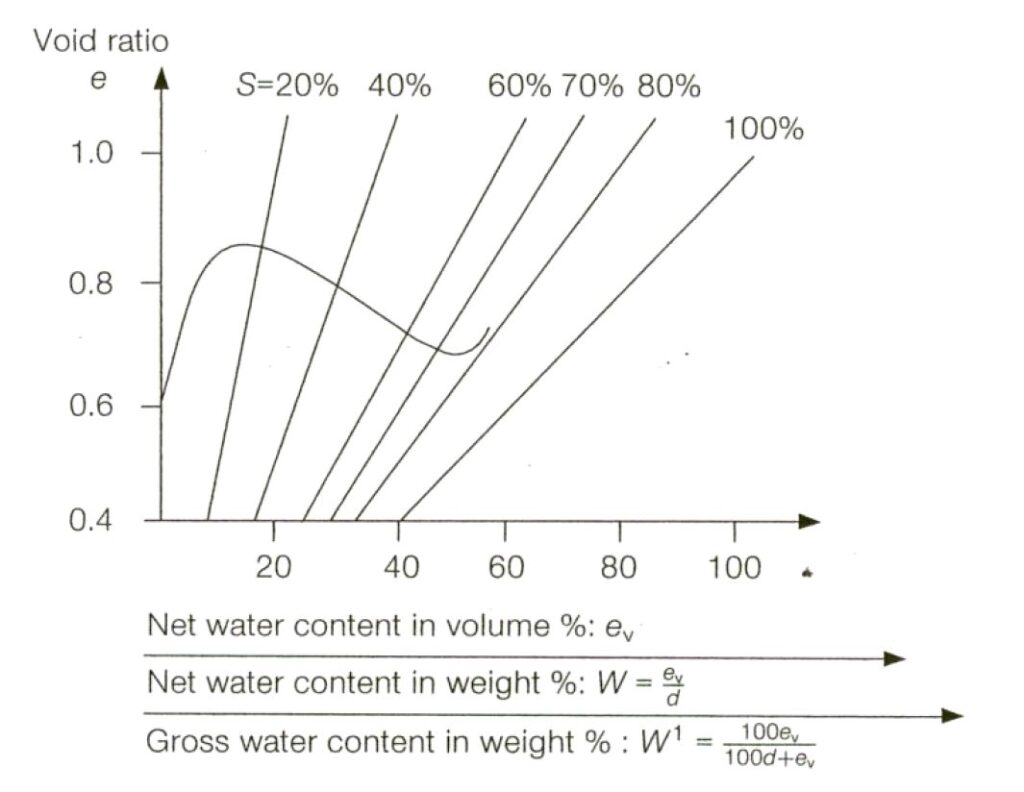
The IMSBC Code sets out the calculations and invites the tester to plot the following graph.
Fortunately the same data can be plotted in a (slightly) more intuitive way, as follows.
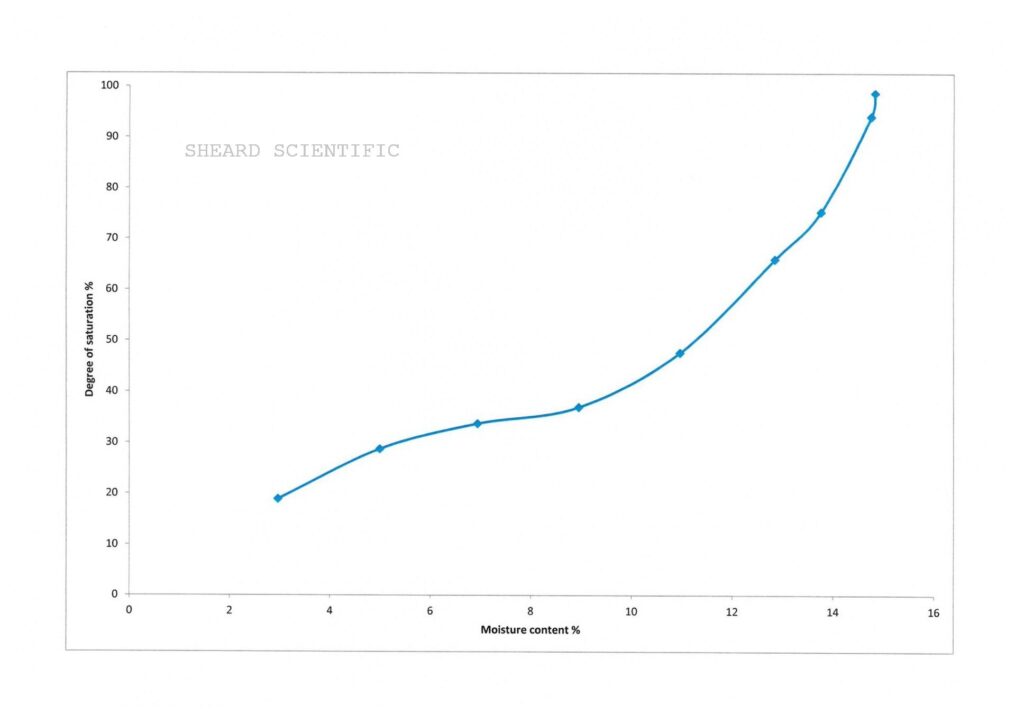
In this graph, the moisture content is plotted vs the degree of saturation that produces in the interstitial void space after compaction using the hammer.
Another disadvantage is again tolerance for large particles. The wording of the standard Proctor/Fagerberg method in the IMSBC Code indicates that it is suitable for materials with maximum particle size up to 5mm. The method goes on to imply that the method can be extended to work on substances having larger particles present but this needs to be investigated prior to deployment. Furthermore, the method states it is not suitable for coal cargoes.
For many years, those three methods were the only ones included in the IMSBC Code. For many mineral concentrates, the three methods would tend to give reliably similar results. Indeed, that was no coincidence. The parameters and TML criteria for the penetration test and the Proctor/Fagerberg test were in both cases selected in order to give similar results to the flow table test on some commonly-encountered mineral concentrate cargoes.
The problems started to become highlighted with the large-scale shipment of (first) nickel ore and then iron ore fines as Group A cargoes. Unlike mineral concentrates generally, these are not heavily processed commodities, and their behaviour when tested is not comparable with concentrate cargoes.
Nickel ore presents a number of challenges to a flow test. I have already mentioned the work-around in widespread use for large particles. Whlist this works, I don’t consider it particularly satisfactory. Unlike concentrates, nickel ore does not have a clearly defined transition from a dry state to a fluid liquefied state – you tend to find, if using the flow table test, that the cone expansion increases gradually over a wide range of moisture contents. Vagueness in the definition of flow state has resulted in large discrepancies in results between different laboratories when testing this material.
Iron ore fines entered the public gaze (the shipping public gaze, at least) a few years later. Iron ore fines cargoes of differnet origins can behave very differently when under test, and some cargoes also present the “oversize” problem but to a lesser degree than nickel ores.
There was considerable debate at IMO level regarding how to test iron ore fines for TML. The existing tests received some criticism for not giving consistent results for this commodity. As a result, when the IMSBC Code was revised to incorporate a schedule specific for iron ore fines, a new test was included at the same time. This test methodology was first published by IMO in late 2013 but was not fully incorporated as a mandatory part of the IMSBC Code until 2017.