Now we are Six
Absolutely nothing to do with A.A. Milne – sorry!
Iron ore fines
I outlined in last week’s post the three tests which have been a familiar part of the IMSBC Code for many years. In 2009 there were two vessels lost in India carrying iron ore fines – ASIAN FOREST and BLACK ROSE. In addition, there were numerous problems which arose during the loading of other vessels. At the time there was no schedule in the Code for iron ore fines as a Group A cargo. As a consequence, work was carried out resulting in new schedules and a new test. As I noted, the existing three tests came in for some criticism for not giving consistent results across a range of different types of iron ore fines. As a consequence, a new test was developed, which is now a part of Appendix 3 of the Code.
That test was based on the Proctor/Fagerberg test, and is referred to in the Code as the “Modified Proctor/Fagerberg test procedure for iron ore fines”. This test methodology makes it clear that it should only be used to test samples of iron ore fines.
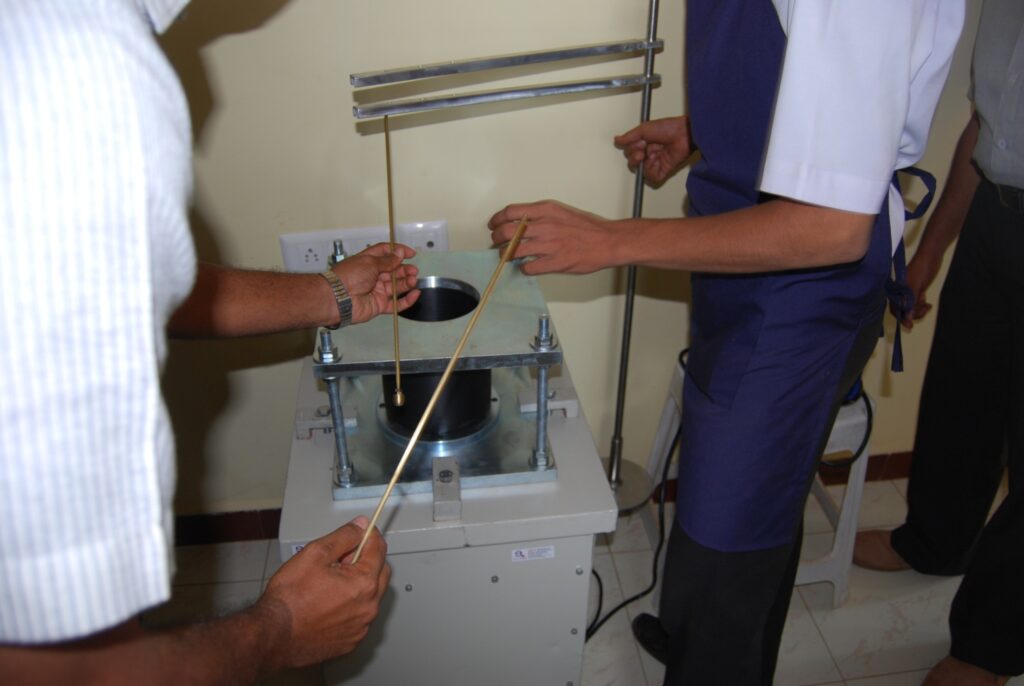
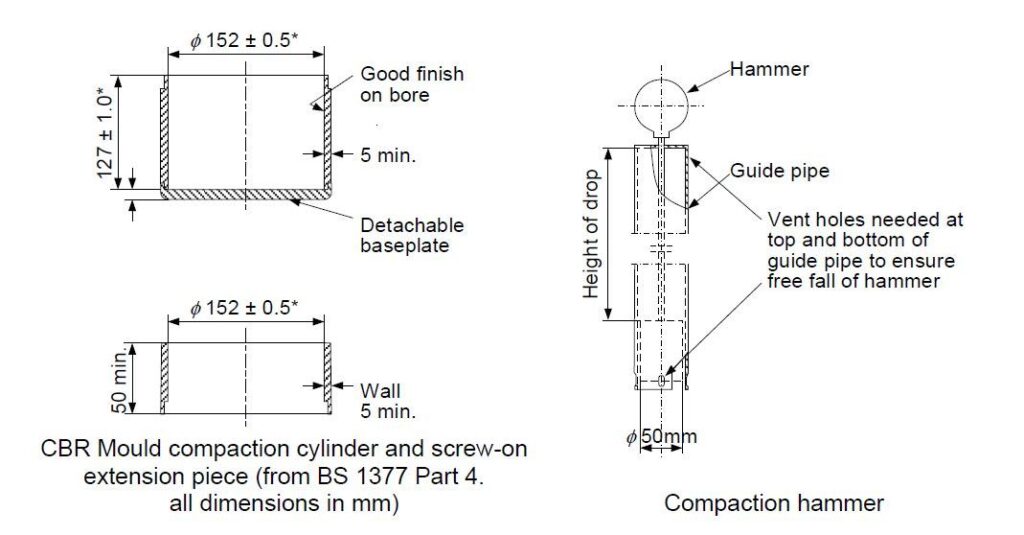
The standard equipment set was used but with a much lighter compaction hammer. This hammer weighs only 150g – less than half the mass of the standard hammer. The size of hammer required for the test was established by reference to work on the conditions experienced in a typical stow of iron ore fines, but it is very light indeed and imparts only small blows on the moulded sample. Even toffee hammers weigh more!
Incidentally, in Proctor’s original work on testing soils, the hammer weighed 2.5kg. Reducing the hammer size to 350g (standard Proctor/Fagerberg, referred to as the “C” hammer) and then 150g (modified P/F, referred to as the “D” hammer) provides substantially less energy input.
Unlike the standard Proctor Fagerberg test, the modified test for use with iron ore fines defines TML as the moisture required to produce 80% of saturation level. The justification for moving the critical point from 70% to 80% is touched upon in the wording of the test methodology in the Code. It says.
Optimum moisture content (OMC) is the moisture content corresponding to the maximum compaction (maximum dry density) under the specified compaction condition. … This test procedure was developed based on the finding that the degree of saturation corresponding to OMC of iron ore fines was 90 to 95%, while such degree of saturation of mineral concentrates was 70% to 75%.
IMSBC Code 2020 Edition, Appendix 3.
The concept of OMC is an important one. Imagine a sample with no water at all. Compaction using the hammer will result in a density which is governed by the intrinsic density of the solid material in the sample together with how well it packs into the mould (i.e. how much air remains after compaction). When water is added, initially the water will assist in lubricating particle to particle contact and will fill some of the voids – thus the density will increase because there is water in the gaps rather than air. Eventually, further additions of water will result in some free water within the sample mould because the voids are as filled as they can be. Because the density of water (1 kg/m3) is lower than the particle density of the ore being tested, adding further water serves to reduce the overall density. A mathematician would refer to this as a “turning point” in density, and the highest density happens at a moisture content known as OMC. OMC will depend on the compaction conditions – i.e. the weight of the hammer and to a lesser extent the shape and size of the mould.
Hence reasoning behind having a higher criterion for TML in iron ore fines. As the Code says, the iron ore fines samples studied had a higher saturation at OMC than was found when studing mineral concentrates using the Proctor/Fagerberg test. The aim is to set a TML which maintains a good safety margin (recall that for the flow table test and penetration test, TML is generally set at 90% of Flow Moisture Point). The reported fact that iron ore fines can typically attain a higher saturation than do concentrates means that the TML can be safely set to a slightly higher saturation level (80% rather than 70%). Well, that’s the theory.
As noted above, the modified Proctor/Fagerberg test for iron ore fines is only applicable to that cargo. This was the first time a TML test had been written into the IMSBC Code which related only to a specific cargo. Note that there is no prohibition on using any of the the original three tests on iron ore fines. The modified Proctor/Fagerberg test for iron ore fines is likely to give higher TML figures than would using any of the other three standard tests. It is odd that one of the driving forces beind the development of the modified test was that the existing three tests did not give consistent results. We now have a situation where a sample of iron ore fines can be tested by any of four methods, and these do not give similar results to each other.
Coal
The next method found in the Code is a modified Proctor/Fagerberg specifically for coal.
It is curious that the standard Proctor/Fagerberg method in the IMSBC Code contains the following statement
This method should not be used for coal or other porous materials.
IMBC Code 2020 Edition, Appendix 3, methodology for standard Proctor/Fagerberg
The way this provision is written is suggestive that the underlying reason the standard Proctor/Fagerberg method is unsuitable for coal samples is because coal is porous.
The modified method for coals uses a similar overall procedure to the standard Proctor method but the vessel has a larger diameter. The test method calls for a “hammer equivalent to the Proctor/Fagerberg D energy hammer” – more on this curiously worded requirement below. Critical moisture is set at 70% saturation, which is the level used in the standard test. If 70% of saturation cannot be attained in the test, the conclusion is that the cargo is not liable to liquefy. It is not clear to me how this addresses the implied difficulty in testing coal/porous materials implied by the wording of the standard method.
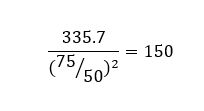
As noted above, the coal test method calls for a hammer equivalent to the D type energy hammer. That is the hammer developed for use with the iron ore fines test, which weighs 150g and has a foot diameter of 50mm. However, the image of the equipment for the coal test shows a different hammer. This has weight 337.5g (nearly as much as the standard C type hammer of 350g). However, the diameter of the foot is 75mm whereas the size of the standard D hammer is 50mm across. Thus the hammer shown for the coal method is heavier than the iron ore fines hammer but has a larger foot. It is equivalent because
The most striking novel feature of the coal Proctor method is a procedure to create a reconstituted working sample where the coal contains particle sizes in excess of 25mm. Many commonly traded coal cargoes are sized up to 50mm, and so many real world coal cargoes will require the reconstitution procedure to be applied. The reconstitution process involves removing “oversize” (i.e. over 25mm in size) and then adding back calculated proportions of smaller particles from the working sample to replace the removed oversize fraction.
I mentioned in my earlier post on testing that a work-around to deal with oversize was in widespread use for nickel ore. The reconstitution process for coal samples is a part of the new modified Proctor/Fagerberg test for coals and is the first approved means of testing samples with particles larger than 25mm.
Many types of coal are not capable of liquefying and are thus not Group A cargoes. Very helpfully the new test contains criteria for determining if a coal is liable to liquefy.
I note that the new modified method for coal states that it requires a minimum of 170kg for a test to be carried out.
There are now three tests which can in theory be used for coal – the flow table test, the penetration test and the modified Proctor/Fagerberg for coal. The new coal test contains a number of elements which are not present in the flow test or penetration test – i.e. the ability to modify samples to allow for the presence of much larger particles and the existence of a diagnostic check in the test to determine whether a given coal is Group A or not.
Bauxite
The final method is specific to bauxite. The existence of this test came about as a consequence of the BULK JUPITER sinking and the work carried out which established and characterised dynamic separation as relevant to bauxite.
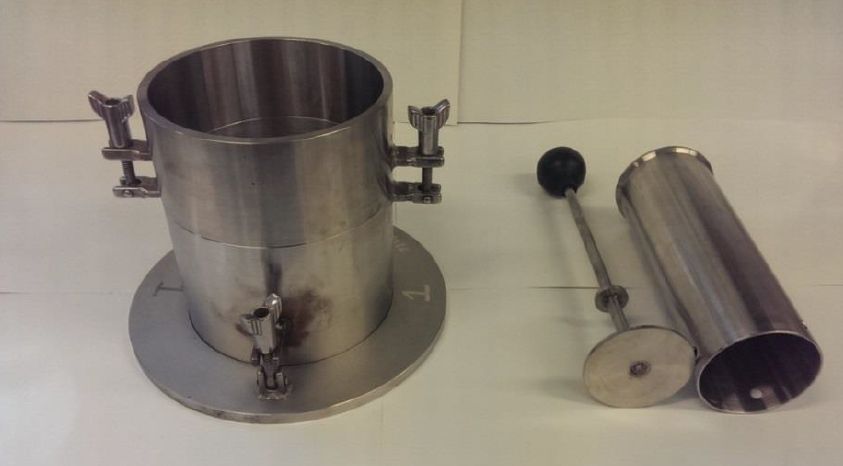
This modified Proctor/Fagerberg test uses the same larger diameter mould called for to test coal. The hammer is the lighter “D” hammer per the iron ore fines method in its 150g diameter 50mm form.
The bauxite method also contains a method for making a reconstituted working sample by removing oversize and substituting smaller material according to a formula/recipe.
The critical saturation level is set at 70% for some bauxites and at 80% for others. The decision between 70 and 80% saturation as the critical point is made by reference to the optimum moisture content – i.e. the highest saturation attained. This choice has at its technical base the same fundamental issue which is given as the rationale for applying a critical level of 80% in the modified test for iron ore fines as discussed above.
As I have discussed in an earlier article, bauxite is said not to undergo liquefaction in the normal sense, but rather to exhibit dynamic separation when overmoist. Dynamic separation is a different failure mechanism to liquefaction. However, the test introduced to ensure safe carriage and a suitable TML is largely the same as that applicable to iron ore fines.
This test is relatively new, and I have personally only seen it in action once. That particular bauxite formed large clay-like lumps with the addition of water and the 150g hammer was not capable of packing the ore into the Proctor mould except at very low moisture contents. Some bauxite types may be more suited to testing using other methods.
Concluding remarks
The recent proliferation of new cargo-specific versions of the Proctor/Fagerberg, together with the three more established standard methods presents a somewhat bewildering picture. Shippers involved in trades for coal, bauxite or iron ore fines will have the option of instructing a laboratory to carry out the cargo-specific test or one of the standard ones. Different commodities may involve the reconstitution procedures to accommodate substantial oversize. For commodities where no “new” cargo-specific test exists, the laboratory will have no established reconstitution procedure and will have to deal with oversize particles in an ad-hoc manner.
Clearly this is unsatisfactory. If reconstitution works for coal or for bauxite, it would be expected that a similar procedure might work for iron ore fines with oversize, or indeed nickel ore which tends to have oversize.
If it is acceptable to relax the Proctor/Fagerberg critical saturation percentage to 80% for iron ore fines and some bauxites, why is it not acceptable to apply 80% to any cargo which has an optimum moisture content (OMC) of over 90%?
If the studies showed that the new tests provide an appropriate TML for bauxite, iron ore fines and coal, where does that leave the “standard” methods in relation to these commodities? My understanding is that the modified Proctor tests introduced recently for these specific cargoes in a number of instances produce higher results for TML (i.e. the cargo can be shipped with higher moisture content). Perhaps the extra safety margin associated with the older tests was unneccesary.
It is possible to attempt to use the new tests for coal and bauxite and be directed by the test protocol to a conclusion that the subject cargo is not Group A. There are criteria in the schedules for iron ore fines, manganese ore fines and bauxite which set out technical parameters for what constitutes a Group A cargo of that mineral. There are no test procedures or criteria available for other materials to determine whether a given substance is Group A or not.
A number of materials mined and subject to relatively little processing contain a variety of minerals. For instance, an ore may contain nickel and also substantial amounts of iron. If an ore from Malaysia contains aluminium and also iron in oxide form, is it bauxite, or is it iron ore?
In my opinion, the proliferaton of multiple cargo-specific tests makes life very much more complicated for those involved and is not a helpful development. I believe it would have been preferable to revise the test methods in the Code to have either a single available test or a number of tests with the selection prescribed by the Code, rather than a “choice”. As always, however, we recommend adhering to the provisions of the Code wherever possible.
Testing, testing, 1, 2, 3
I wrote last week about liquefaction generally and tried to set the scene. Fundamental to safe carriage in the IMSBC Code is the concept of Transportable Moisture Limit (TML). It has been suggested that a single figure for a cargo does not properly reflect all possible behaviours, but in my experience the safety margin built into the Code is sufficient that if you apply the TML concept properly, the cargoes will carry without significant incident. Indeed, the idea of a TML has gained such traction recently in the maritime industry that I sometimes see figures for “TML” on declarations for agricultural cargoes which aren’t Group A at all – it is being erroneously used to indicate the maximum safe moisture level for avoiding cargo deterioration on board.
Returning to Group A cargoes, Section 8 of the Code tells you that there are test methods for determining TML, and the standard/recommended ones are to be found in Appendix 3 to the Code.
Unfortunately, Appendix 3 is where testing starts to get complicated. There are now no fewer than six different methods listed in the appendix. Three of these are variations on the Proctor Fagerberg test modified to be suitable for specific commodities and are relatively new additions to the Code.
Until recently, there were three methods listed in the Code, and those three will be the subject of this article. It has always been within the power of the various member Competent Authorities to approve alternative test methods, but as far as I am aware this has never been commonly encountered if at all. Furthermore, until relatively recently, the only method widely available internationally at commercial labs was the Flow Table Test.
The concept of TML was developed from another parameter, the Flow Moisture Point (FMP), and the original research into safe moisture levels and cargo testing was carried out on metal sulphide concentrates. Concentrates such as lead, zinc and copper have been shipped for many years and all tend to be Group A cargoes.
Flow Table
The flow table test measures FMP, which is defined as the moisture content at which a commodity starts to exhibit flow properties. The test involves inputting energy in a defined manner into the sample and monitoring the behaviour of the sample under those conditions.
Flow is defined for the flow table test when the cone of sample on the table spreads by a certain amount or slumps. If the sample doesn’t exhibit flow, water is added and the test repeated until it does. By this procedure, the flow moisture point is established by actually determining the moisture content of samples which have shown flow properties during the test along with those which do not.
One potential difficulty with the flow table test is that the methodology requires the operator to determine when a sample is in a flow state by observations during the test itself. The Code does not define exactly how, although there are descriptions of what to do.
Each test run involves a sample being loaded into the mould in a prescribed way. A spring-loaded device known as a tamper is used to squash the sample into the mould and provide a degree of compression/consolidation to start with. One problem with the flow table test which has largely now been solved is that the necessary calibrated spring-loaded tamper wasn’t available commercially.
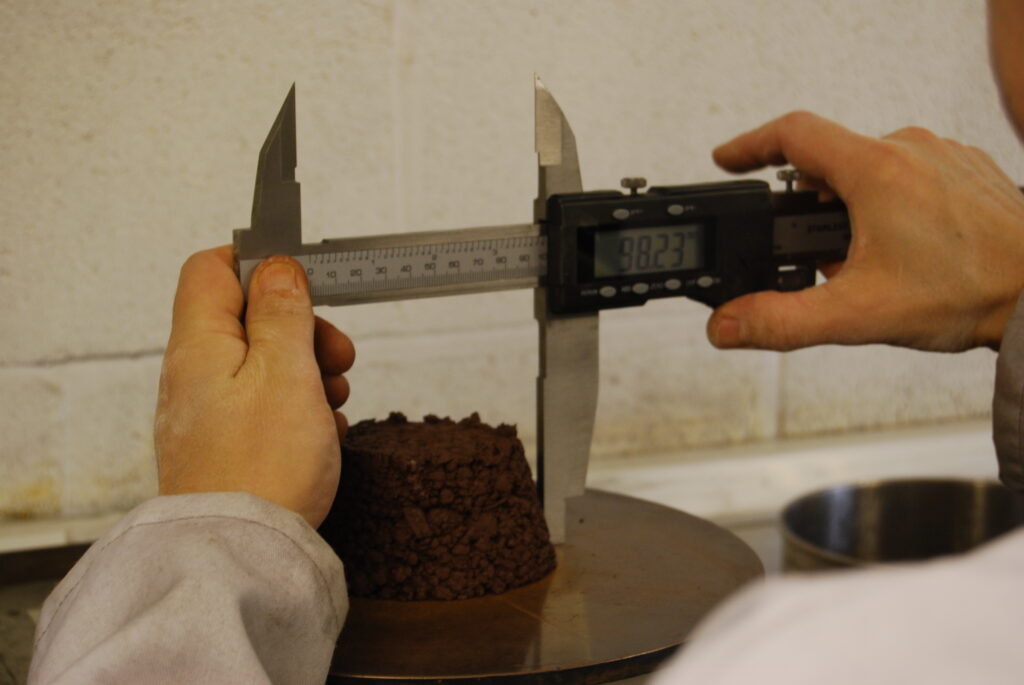
Following removal of the metal mould shape, the resulting cone is measured prior to operating the table.
The table is then operated (up to) 50 times. Each turn of the handle lifts the table and allows it to drop 12.5mm. The method calls for the 50 drops to take two minutes.
After the table has been operated 50 times, the resulting material on the table is examined and measured. The IMSBC Code says measurements of the diameter are a useful diagnostic, and refers to a cone expansion of 3mm as being significant. Different laboratories have used this information in different ways. I can’t go into too much detail in this article but if full documentation of the test conditions is available from the laboratory, an expert can see how the stated result was obtained and what criteria were used.
The flow table is relatively inexpensive to buy, but it is important to ensure that a table meets the required design specification.
There are limitations associated with the flow table test. One is a consequence of the physical size of the mould into which the sample is placed on the table and relates to the maximum particle size.
The flow table is generally suitable for mineral concentrates or other fine material with a maximum grain size of 1 mm. It may also be applicable to materials with a maximum grain size up to 7 mm. It will not be suitable for materials coarser than this …
IMSBC Code Appendix 3
Widespread use of the flow table test for nickel ores having a proportion of much larger particles present has now been in place for a number of years, but the “fix” used has never been approved by IMO.
This fix works by considering nickel ore to be an assembly of larger particles embedded in a continuum made up of the more fine material. The flow table test criteria of 7mm is a workable limit for many nickel ore cargoes – removing the material above this size results in a testable working sample. The assumption made is that the liquefaction of the material as a whole (with the oversize) is solely governed by the behaviour of the sub-7mm fraction. The oversize is present in the cargo but is “along for the ride” without participating in the liquefaction. There is a further assumption which is that the moisture associated with the larger particles remains with them when sieved out, leaving the moisture associated with the finer material. Thus if flow table testing is carried out on the 7mm fraction alone, that provides a TML relevant to sieved samples. Provided the average moisture content is also tested on a sieved sample, the effect will be to ensure that the moisture level in the sub-7mm part of the cargo as a whole is below its TML, and hence the cargo can be assumed to be safe.
The obvious problem with this approach is that the moisture content of a sieved sample will tend to be different to the cargo as a whole. Most cargoes are bought and sold on terms which include specifying the cargo moisture levels. That isn’t for safety reasons but rather to act as a control for how much water is being bought rather than (here) nickel-bearing ore. Thus the moisture content entered onto the cargo declaration is not the same as the one used in the cargo sales contract. It is sometimes difficult to establish whether this has been done correctly.
Penetration Test
The penetration test was developed in Japan as an alternative to the flow table test, but it has certain similarities. This test is also repeated with additions of water until the sample exhibits flow properties. For this test, the energy input into the sample is in the form of a vertically oscillating platform onto which the sample is placed in a vessel. These vessels are much larger than the conical moulds used for the flow table test, and hence the penetration test can accept much larger particles.
The penetration test is generally suitable for mineral concentrates, similar materials and coals up to a top size of 25 mm.
IMSBC Code Appendix 3
The ability to accept samples containing much larger particles is one advantage of the penetration test. Another is that the definition of a flow state is given in terms of the distance penetrated by brass weights into and below the sample surface during the six minutes the vibrating table is run for on each test run. No subjective observation is required. The rate and amplitude of oscillation of the table are specified in the Code. In the video below a sample of iron ore fines can be seen to enter a flow state – signified by the brass weight penetrating the sample surface. Note that the video has been shortened from the original six minutes.
The flow table test and the penetration test have one fundamental thing in common. During the testing itself, each test run involves taking a working sample and subjecting it to the input of energy. This is meant to simulate the vibrations and motion on a ship, which is when liquefaction might take place. Water is added and the test runs repeated until a flow state is achieved, and thus the flow table and penetration test both create a flow state which the operator will see. In the flow table test, the sample will slump and expand during the test. On the penetration test rig, the metal bit will sink into the cargo sample, and other changes in the sample will be seen – perhaps water will come to the surface or the surface will become smooth.
Equally, if the sample is received in a state in which a flow state occurs on the first test, the operative will know immediately that the cargo as sampled will not be considered suitable for carriage.
The Code defines TML as 90% of the FMP for most materials. That 10% is a safety factor.
Proctor/Fagerberg Test
The third of the three long-standing tests is the Proctor/Fagerberg test. Until relatively recently this was not in widespread use in shipping, but it has always had its fans. This test works on a different principle to the flow table and penetration test. Here, the test runs involve packing the material of the cargo sample into a mould using a hammer. The weight of that hammer is specified by the method as 350g. The different test runs are not designed to result in liquefaction, and indeed no visual observations are required.
Liquefaction happens when the balance between solid particles, interstitial air and interstitial water is such that rearrangement of the assembly of particles when exposed to energy/vibration results in the interstitial water mediating particle to particle contact. The pressure of that water then supports the material above rather than particle to particle contact. This process was introduced with an illustrating diagram in my last article on liquefaction.
Proctor/Fagerberg replicates that compaction and rearrangement process using the hammer blows. As the density changes with increasing water, the test observations can be used to produce a curve from which the transportable moisture limit (TML) can be obtained.
The Proctor test does not produce an FMP and no observations of the cargo in a flow state will be possible during a test. The calculations required to process the raw data obtained during a test run, in order to plot a meaningful graph and establish a figure for the TML, are somewhat complex, and are a possible source of errors during testing. TML in this test is defined in terms of the moisture required to produce 70% saturation in the sample under compaction. Without the visual observations from the test itself there is no “sanity check” on the result obtained. That is one disadvantage of the Proctor/Fagerberg test.
The IMSBC Code sets out the calculations and invites the tester to plot the following graph.
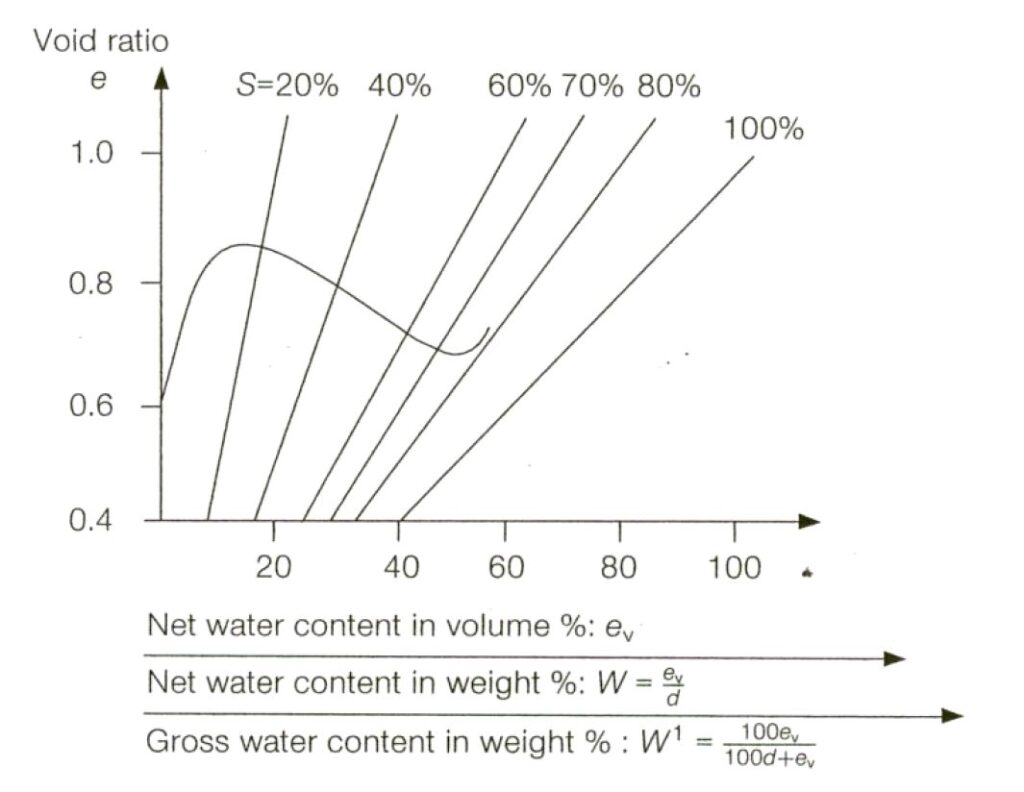
Fortunately the same data can be plotted in a (slightly) more intuitive way, as follows.
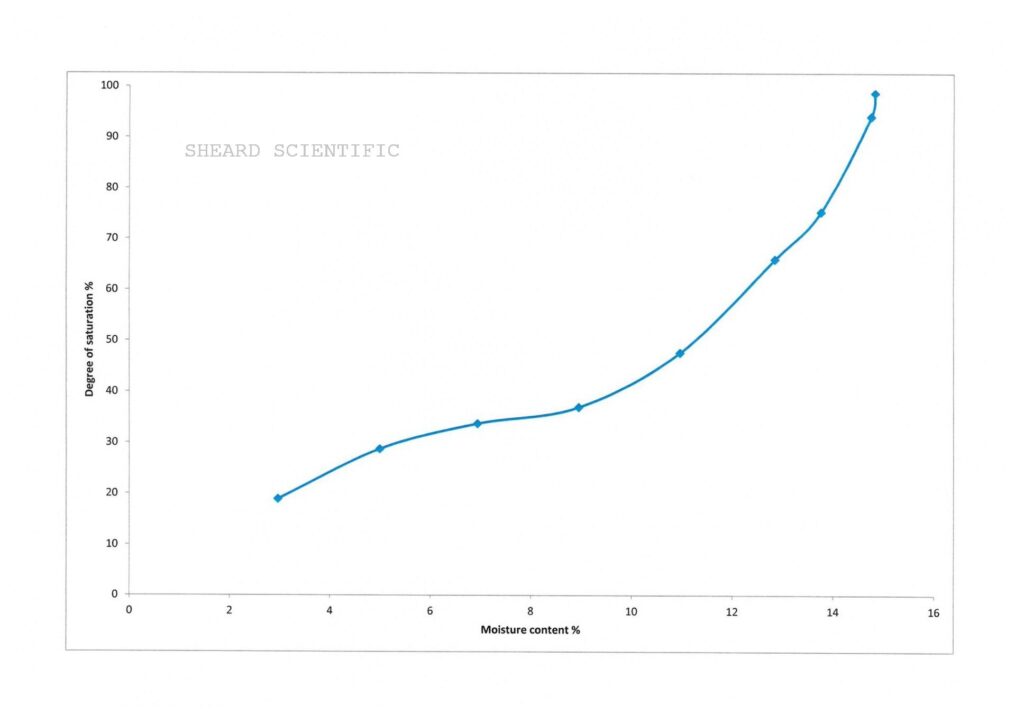
In this graph, the moisture content is plotted vs the degree of saturation that produces in the interstitial void space after compaction using the hammer.
Another disadvantage is again tolerance for large particles. The wording of the standard Proctor/Fagerberg method in the IMSBC Code indicates that it is suitable for materials with maximum particle size up to 5mm. The method goes on to imply that the method can be extended to work on substances having larger particles present but this needs to be investigated prior to deployment. Furthermore, the method states it is not suitable for coal cargoes.
For many years, those three methods were the only ones included in the IMSBC Code. For many mineral concentrates, the three methods would tend to give reliably similar results. Indeed, that was no coincidence. The parameters and TML criteria for the penetration test and the Proctor/Fagerberg test were in both cases selected in order to give similar results to the flow table test on some commonly-encountered mineral concentrate cargoes.
The problems started to become highlighted with the large-scale shipment of (first) nickel ore and then iron ore fines as Group A cargoes. Unlike mineral concentrates generally, these are not heavily processed commodities, and their behaviour when tested is not comparable with concentrate cargoes.
Nickel ore presents a number of challenges to a flow test. I have already mentioned the work-around in widespread use for large particles. Whlist this works, I don’t consider it particularly satisfactory. Unlike concentrates, nickel ore does not have a clearly defined transition from a dry state to a fluid liquefied state – you tend to find, if using the flow table test, that the cone expansion increases gradually over a wide range of moisture contents. Vagueness in the definition of flow state has resulted in large discrepancies in results between different laboratories when testing this material.
Iron ore fines entered the public gaze (the shipping public gaze, at least) a few years later. Iron ore fines cargoes of differnet origins can behave very differently when under test, and some cargoes also present the “oversize” problem but to a lesser degree than nickel ores.
There was considerable debate at IMO level regarding how to test iron ore fines for TML. The existing tests received some criticism for not giving consistent results for this commodity. As a result, when the IMSBC Code was revised to incorporate a schedule specific for iron ore fines, a new test was included at the same time. This test methodology was first published by IMO in late 2013 but was not fully incorporated as a mandatory part of the IMSBC Code until 2017.
Liquefaction – some basics
By now, most of those involved in shipping bulk cargoes know that some commodities can undergo liquefaction. Quite what that means is less well known, but it is very well publicised that it can result in ships sinking. Articles regularly appear setting out how many ships have been lost and the number of people who have lost their lives when their vessels have got into difficulties during carriage.
There is much less information available on the “nearly” events, or even the “we worked hard to avoid” events. I have personally been involved in a substantial number of both of these. Timely advice and/or intervention can save ships and lives. I’m pleased to be able to say that no vessel I have been involved with has subsequently been lost. Suffice it to say that the cost to the industry of problems arising from liquefaction generally is very high.
IMO categorises bulk cargoes which can liquefy as being in cargo Group A.
To comply with the regulations, the moisture content of a Group A cargo needs to be below the transportable moisture limit (TML).
Concentrates or other cargoes which may liquefy shall only be accepted for loading when the actual moisture content of the cargo is less than its TML
IMSBC Code 2020 Edition paragraph 7.3.1.1
What is TML and how is it measured? In a classic example of circular definition, the Code tells you that TML is
Transportable moisture limit (TML) of a cargo which may liquefy means the maximum moisture content of the cargo which is considered safe for carriage in ships …
IMSBC Code 2020 Edition section 1.7
A later post will discuss the tests, as these and how they work is a whole topic in itself.
Liquefaction is a bulk property. One common misconception is that liquefaction involves cargoes becoming a liquid, and indeed the IMSBC Code uses this word to describe a flow state. Many liquefied cargoes however do not behave like liquids. “Fluid behaviour” is perhaps a better term to use.
As a physicist, I will introduce the concept of a phase change, as I believe the analogy is helpful. To a physicist, a change of phase involves a material changing from a state in which it has certain properties to a state where it behaves differently. An obvious example is melting a solid such as ice. Whilst the ice is frozen, its behaviour is like other solids. Melted, it becomes water which can be poured, sloshed, and so on but it is chemically still H2O. The phase change we refer to as melting involves the input of energy. So does liquefaction. A solid bulk Group A cargo can may enter a fluid state if conditions are within certain limits and with the input of energy.
A very widely viewed video shows a wheelbarrow full of soil undergoing liquefaction when energy in the form of vibration over a set of cobblestones is input.
Back in 2009, the year ASIAN FOREST and BLACK ROSE sank in India, I created this diagram.
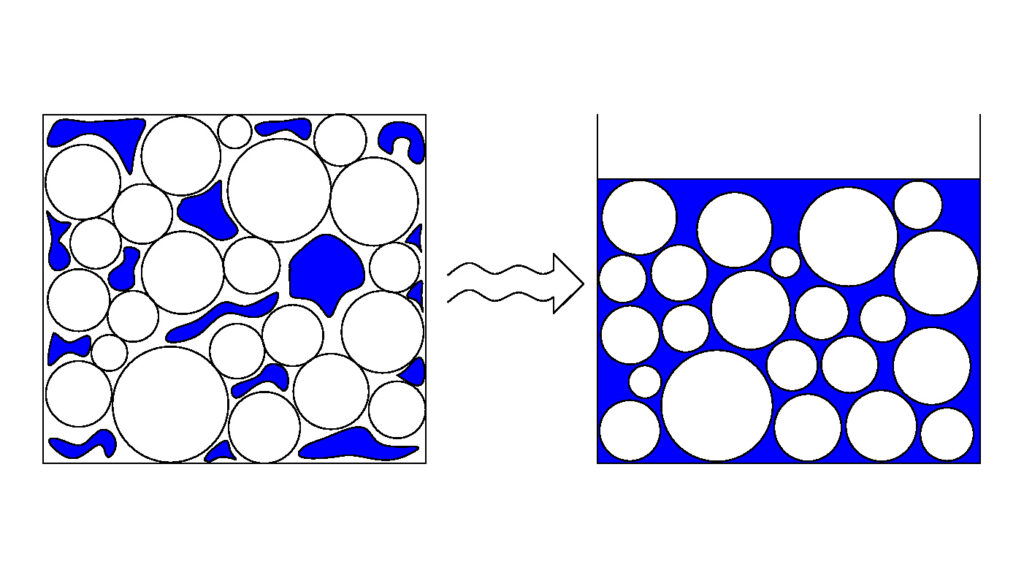
Facsimiles of this illustration exist, even variants where the particles are not circles/spheres. All the attempts to “improve” on my illustration/concept focus on aspects of it which didn’t really need to be updated/modified.
In this example, the assembly of particles is shown to be a collection of spheres (circles in cross-section). That wasn’t chosen because it matches the particles in a cargo of iron ore or nickel ore, but rather because it allows the phenomenon I am illustrating to be clearly seen. The diagram shows a phase change. On the left, the solid particles are loosely packed. There are lots of spaces between them. In those spaces can be found the moisture associated with the cargo (the blue areas). The particles are in contact with each other and the water (blue) is simply present. It doesn’t do anything.
Follow the wavy arrow to the right hand side; there to represent the input of energy in the form of vibration during a sea passage. In the right hand image, you will find exactly the same circles/spheres. Here however the whole assembly occupies a smaller volume than did the left hand image. Thus the input of energy has resulted in consolidation of the cargo into a smaller volume. Further, the image shows blue water throughout the interstitial spaces.
The point the image is illustrating is that the sequence of events involves consolidation/compaction as a consequence of the input of energy. The same volume of solid particles is now associated with less interstitial volume and, if there is enough moisture present, that might result in the water filling the voids on the right hand side when it did not on the left. Liquefaction. The particles on the right are separated by water and it is the water which governs the bulk properties. Pore water pressure is the name given to the pressure associated with the water in the spaces, and in a liquefied stow it is the pore water pressure which supports the cargo above. Water, being a liquid, is nearly incompressible – the volume of water stays the same at all times, it is the volume of the interstitial pores which changes.
The Proctor/Fagerberg test works on this principle – the test is designed to measure the amount of water expressed as a volume percentage of the available space (void/interstitial). Thus the image on the right of my diagram would be 100% saturated in Proctor Fagerberg terms. The energy input in the Proctor test comes from a slide hammer pounding the surface of the sample. I will write about the tests and how they work in a later article.
Many of the provisions in the IMSBC Code (or BC Code as it was a number of years ago) arise from studies carried out on samples of metal concentrates. It is worth remembering this when consulting the Code even today. Concentrates are a semi-manufactured intermediate product and tend to be very consistent in terms of particle sizing. The provisions in the Code allow for TML certification to be up to six months prior to the voyage. These make sense if we are dealing with a cargo of concentrates from a process which churns out parcels of that commodity which are very much the same in terms of flow properties from month to month, even year to year. The same provision makes no sense whatsoever when dealing with shipment of nickel ore or iron ore fines; these receive little processing prior to shipment and the flow properties depend on the geological conditions in the mine.
There are a number of phenomena reported regularly when vessels are affected by liquefaction. As I have said above, the cargoes tend not to behave like liquids, but rather very dense fluids. The stow may flatten out – an untrimmed/peaked stow may turn into a wholly flat surface. There may be water expressed to the surface of the stow. Look at my diagram above – on the right hand image there wasn’t enough room for the inherent moisture and some of it ended up on top of the cargo. That water is simply a liquid and will be free to form a free surface. A free surface of water will affect the stabilty of the vessel but often the amount of water actually on the surface isn’t large, even though it may look spectacular when in motion.
When many cargoes liquefy, the whole stow, or large parts of it, can become mobile. That is a result of the particle to particle contact being prevented by the interstitial water. There are often reports of the vessel taking on a list. This tends not to be an angle of loll, but rather a result of the cargo moving. What can happen is that when the cargo becomes mobile when in a fluid state, it moves to one side with the natural roll of the vessel. It then doesn’t return to centre when the vessel rolls back. Gradually, over a number of roll periods, the cargo takes up position biased towards one side of the hold, resulting in the list. This is of course very dangerous as eventually that list may become large enough for down-flooding with sea water to occur. This is one example of liquefied cargoes not behaving as liquids as it is the asymmetric behaviour of the cargo which results in the list developing.
The case of bauxite as highlighted by the tragic loss of the BULK JUPITER and the lives of 18 of her crew members is interesting. Work followed which resulted in new provisions in the IMSBC Code for Group A bauxite cargoes. It has been strongly argued that bauxite does not undergo liquefaction, and a new term “dynamic separation” has been coined to describe its behaviour. This BIMCO article has a clear description of the difference between dynamic separation and liquefaction. In dynamic separation, the cargo splits into two phases. A lower phase containing the cargo solids is initially immobile despite being saturated with water. It is not in a liquefied state. There is however a volume of free water expressed to the surface (which may be a slurry containing some very fine particles of solid cargo). That water phase is mobile and the risk to the ship’s stability comes from the free surface effect of the water. Only when the vessel’s stability has been compromised by the free surface effect to produce a substantial list might the lower solid phase move.
The new bauxite fines schedule has an interesting provision.
An atypical motion of the ship (wobbling) may also be indicative of cargo instability and the master shall consider appropriate action.
IMSBC Code 2020 Edition
I have heard presentations from members of the bauxite working group where this “wobble” was stressed as one of the clear “red flag” moments a vessel should be watching out for when carrying bauxite fines. A video is often shown which was produced by AMSA to illustrate the behaviour of vessels encountering dynamic separation. I would encourage the reader to watch it carefully.
It is important to note that the video does not show anything liquefying. The motion seen by the model in the video is governed by its buoyancy and the motion of the steel balls in the tracks. Those tracks are shaped to produce a harmonic motion rather like a pendulum. Having two or more balls on the tracks at the same time produces a form of coupled motion. Coupled harmonic oscillators can exhibit extremely unpredictable behaviour. The well-known Rotts Pendulum is an example – this couples two pendulum rods with different lengths and weights. The resulting behaviour can swap back and forth between wobbles and seemingly random modes.
The AMSA video is simply showing coupled harmonic oscillators on a floating system. As an illustration of the consequences of dynamic separation this is appropriate because it is a free fluid phase (the expressed water) which is compromising the stability. This is not the same mechanism which gives rise to the asymmetric behaviour I have described above for cargoes undergoing liquefaction.
For a vessel at a port loading a cargo, the distinction between liquefaction and dynamic separation isn’t obviously significant. Both are behaviours exhibited by Group A cargoes. Both require a TML to be certified and require the moisture content of the cargo to be below the TML for safe carriage. Many natural unprocessed ores contain a mixture of different minerals. Thus the distinction between nickel ore, iron ore and bauxite may depend more on the intended processing and use than the actual make-up of the ore itself.
Vessels carrying Group A cargoes have successfully reached discharge port with mobile cargo in one or more holds. It is however a huge risk. Similarly, carriage of cargo which is overmoist does not necessarily result in either liquefaction or indeed in the vessel getting into difficulties.
The reverse however is clear. To the best of my knowledge, no vessel has loaded cargo which meets the criteria of the IMSBC Code (i.e. with average moisture properly below a reliably tested TML, properly trimmed) and has subsequently had difficulties with cargo liquefaction unless there has been actual water ingress into the holds.
The message then remains the same as it always has. If you wish to carry a Group A cargo safely (and you should), the IMSBC Code should be followed. That means proper sampling being carried out prior to loading, and those samples being reliably tested for moisture and a TML established by a laboratory properly equipped and experienced in carrying out the tests in question. In my opinon there is no substitute for this which can guarantee the same degree of safety.